
Using the RightMessage Debugger
The RightMessage Debugger is a testing tool that lets you see exactly how your personalization works and preview how different visitor segments experience your website. To activate it, add ?debug=true to any URL where RightMessage is installed.
Only you can see the debugger interface. Your regular site visitors won't see any debugging information or tools.
How to Access the Debugger
Add ?debug=true to any page where RightMessage is installed. A trigger button appears in the bottom-right corner — click it to open the debugger panel. Press Escape or click the trigger again to close it.
The debugger appears as a resizable overlay at the bottom of your page. You can drag to resize it or collapse it when not in use.
Debugger Tabs
The debugger has seven tabs in the left sidebar, each showing different aspects of how RightMessage is working on your page:
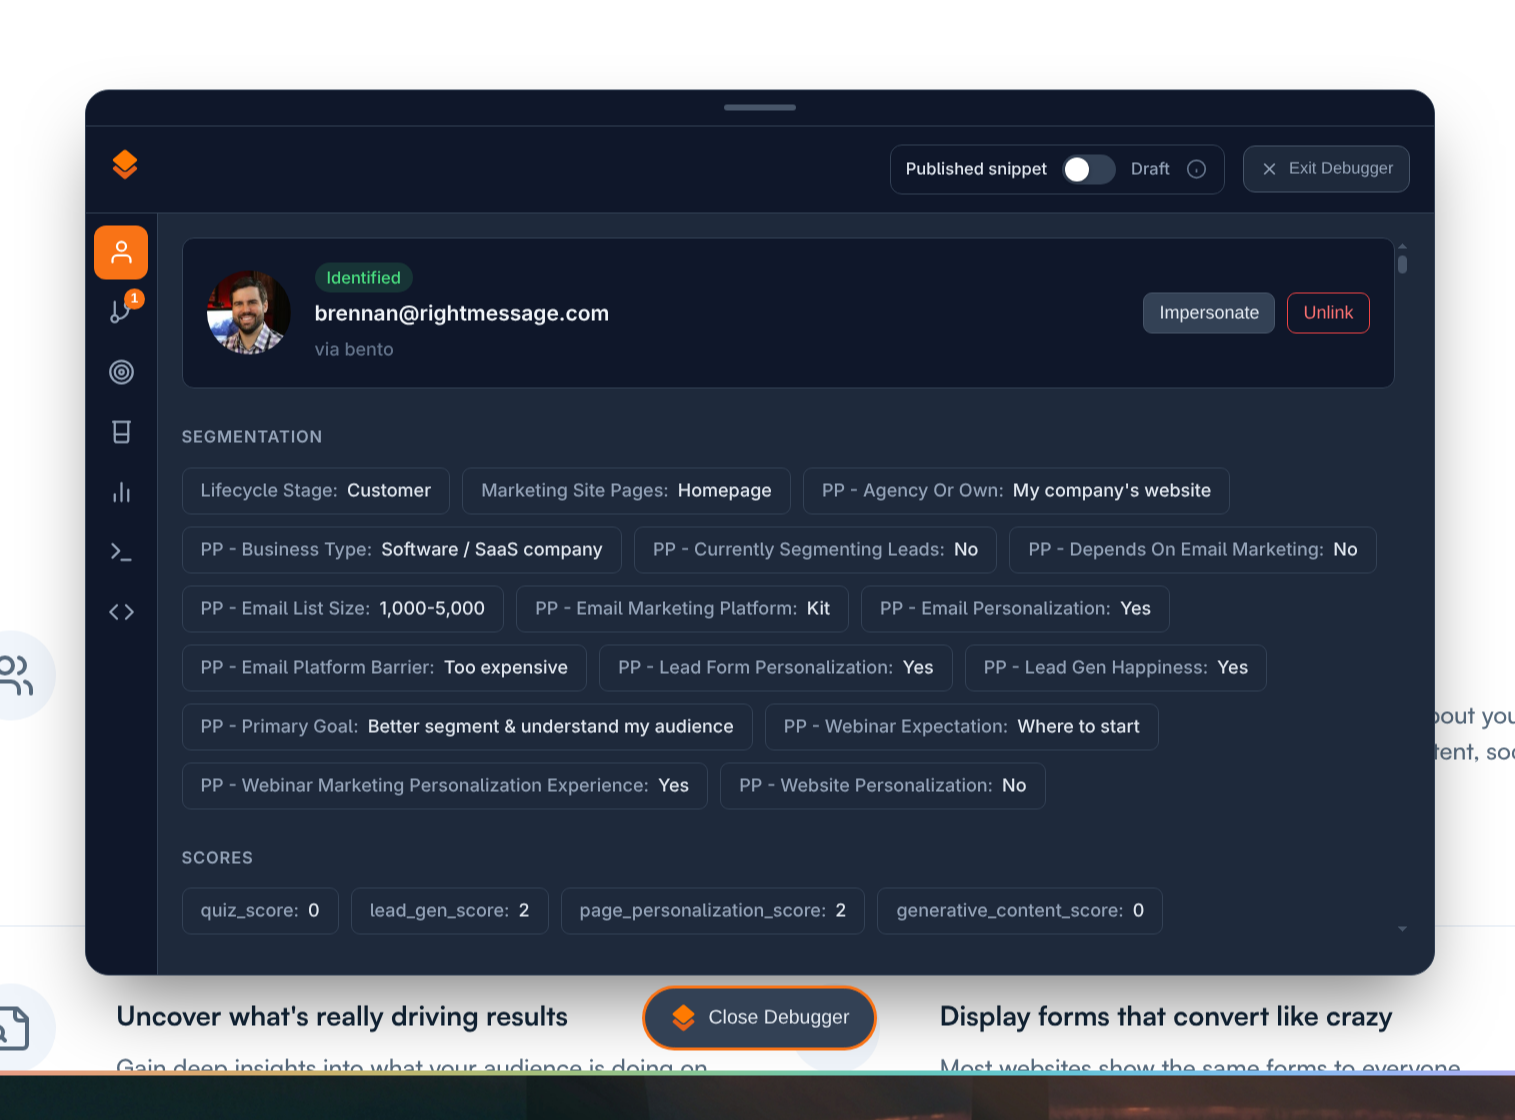
Visitor
Shows information about the current visitor:
Identification source: How we identified this visitor (e.g., "via Kit" if they came from your email)
Segments and tags: All segments and tags assigned to this visitor
Custom fields: Any custom field data we have
Timeline: Recent page views and traffic sources
You can click Impersonate to test as a different subscriber by entering their email address. Click Unlink to clear all identification and start fresh as an anonymous visitor.
Flows
Displays active and waiting Flows (surveys/quizzes) on this page:
Active flows: Shows the step-by-step progress through each flow, including questions answered and timing for each step
Waiting flows: Flows that have been dismissed, with a countdown showing when they'll appear again
This tab is useful for testing flow logic and seeing why a particular flow is or isn't appearing.
Personalization
Shows all active personalization campaigns on this page in a detailed table:
Campaign name: Which campaign is running
Selector: The CSS selector being targeted (e.g.,
.header-text)Affected elements: How many elements on the page match that selector
Modifications: Exactly what's being changed (text, styles, classes, visibility)
This tab updates in real-time as you test different segments. It's the best way to verify your campaigns are working correctly and troubleshoot targeting issues.
Test Segmentation
Lets you override segment assignments to preview how different visitors would experience your site:
Choose segments from the dropdown menus for each dimension (e.g., "Business Type," "Experience Level")
Your page content, campaigns, and flows update instantly to match what that segment would see
Mix and match segments to test complex personalization scenarios
The badge on this tab shows how many segment overrides are currently active. Click the red "(remove override)" option to clear an override.
Use this to QA your personalization before publishing. Test all segment combinations to make sure the right content appears for the right people.
Analytics
Shows events that would normally be tracked to your analytics, but in debug mode they're only simulated (not actually sent). Click any event header to see the full JSON data that would be submitted.
This is useful for verifying that form submissions, flow completions, and other events are being tracked correctly.
Debug Log
Real-time technical log of everything RightMessage is doing on your page:
Script loading and initialization
Widget mounting and configuration
Errors or warnings
Integration status updates
Use the "Filter by type" dropdown to focus on specific message types. Click any log entry to see detailed JSON data.
This tab is especially valuable when troubleshooting widget placement, verifying script installation, or debugging timing issues.
Liquid Variables (Advanced)
Shows all available Liquid variables and their current values in a searchable table. Each row displays the variable path (e.g., {{ visitor.email }}) and its value.
Use this when building custom Liquid templates to see exactly what data is available for the current visitor.
Draft vs. Published Toggle
At the top of the debugger, you'll see a toggle to switch between Published and Draft mode:
Published: Shows what live visitors currently see
Draft: Previews unpublished changes you've made
This lets you test changes before publishing them to your audience.
Best Practices
Start by checking the Visitor tab to confirm you're identified correctly and have the segments you expect. Then use Test Segmentation to preview different audience experiences.
Check the Personalization tab to verify campaigns are targeting the right elements and making the correct modifications. If something looks wrong, the selector and modifications columns will show you exactly what's happening.
Use the Debug Log when troubleshooting. If a widget isn't appearing or a campaign isn't running, the log will tell you why.